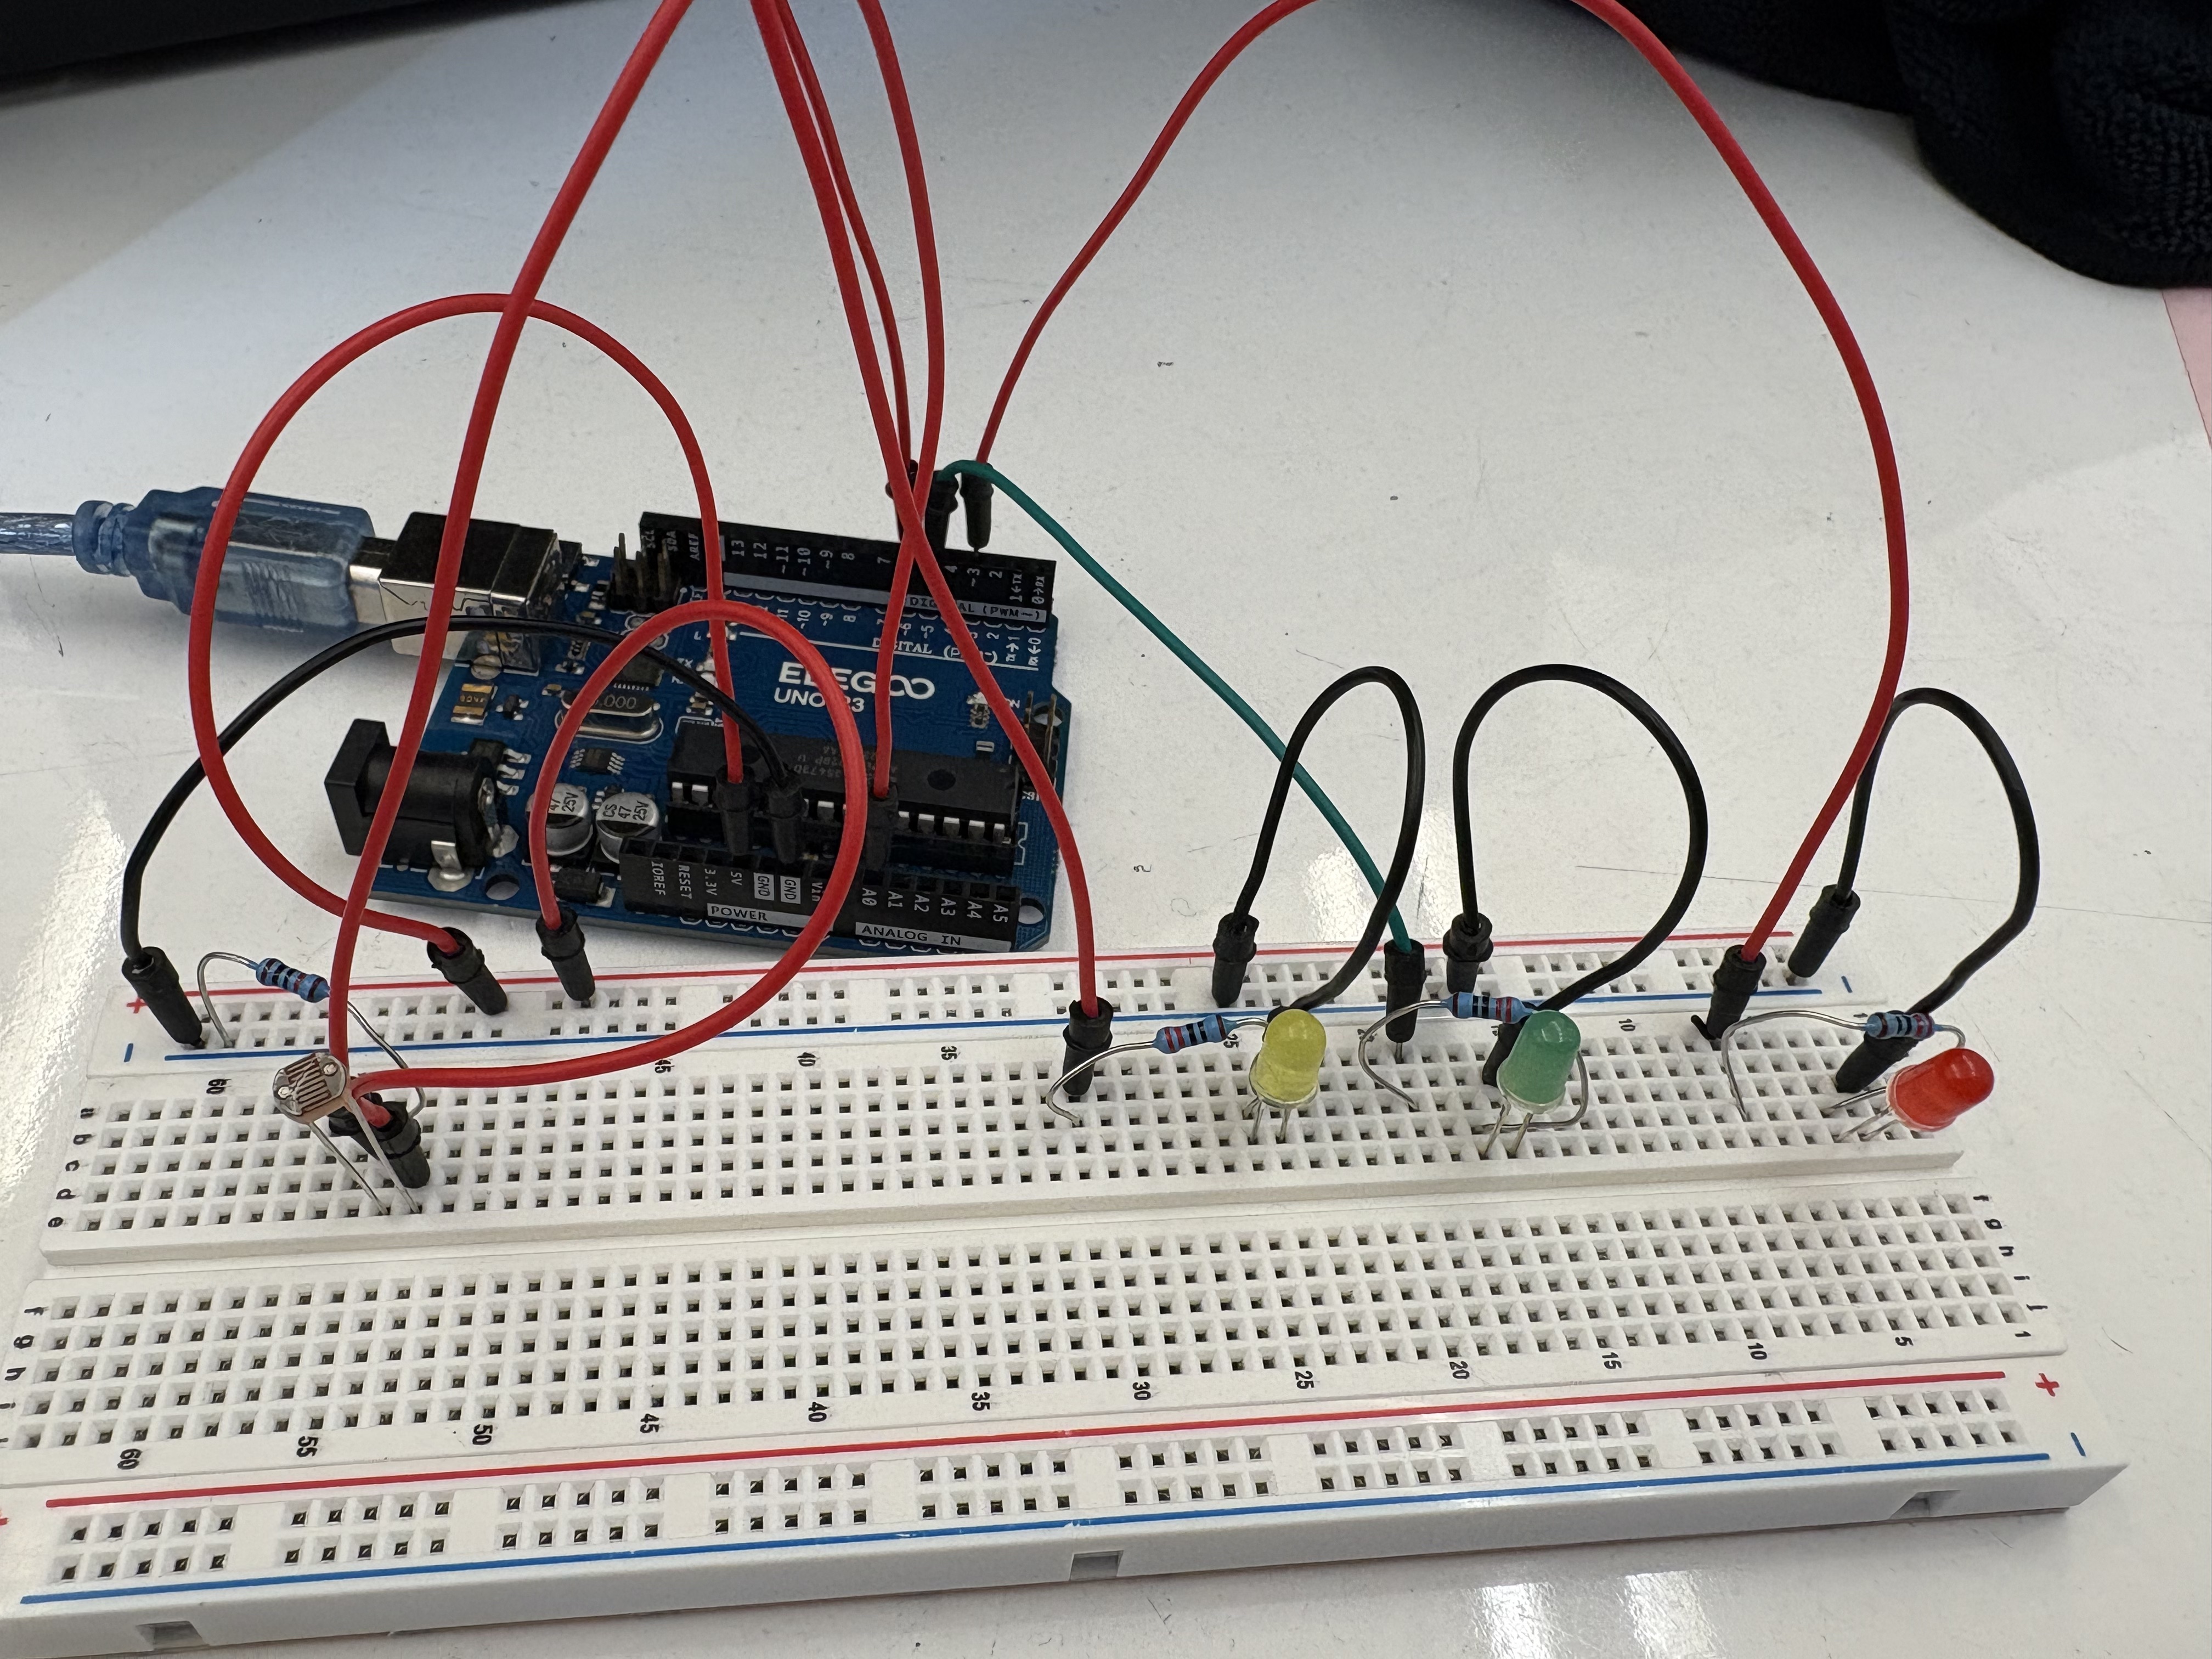
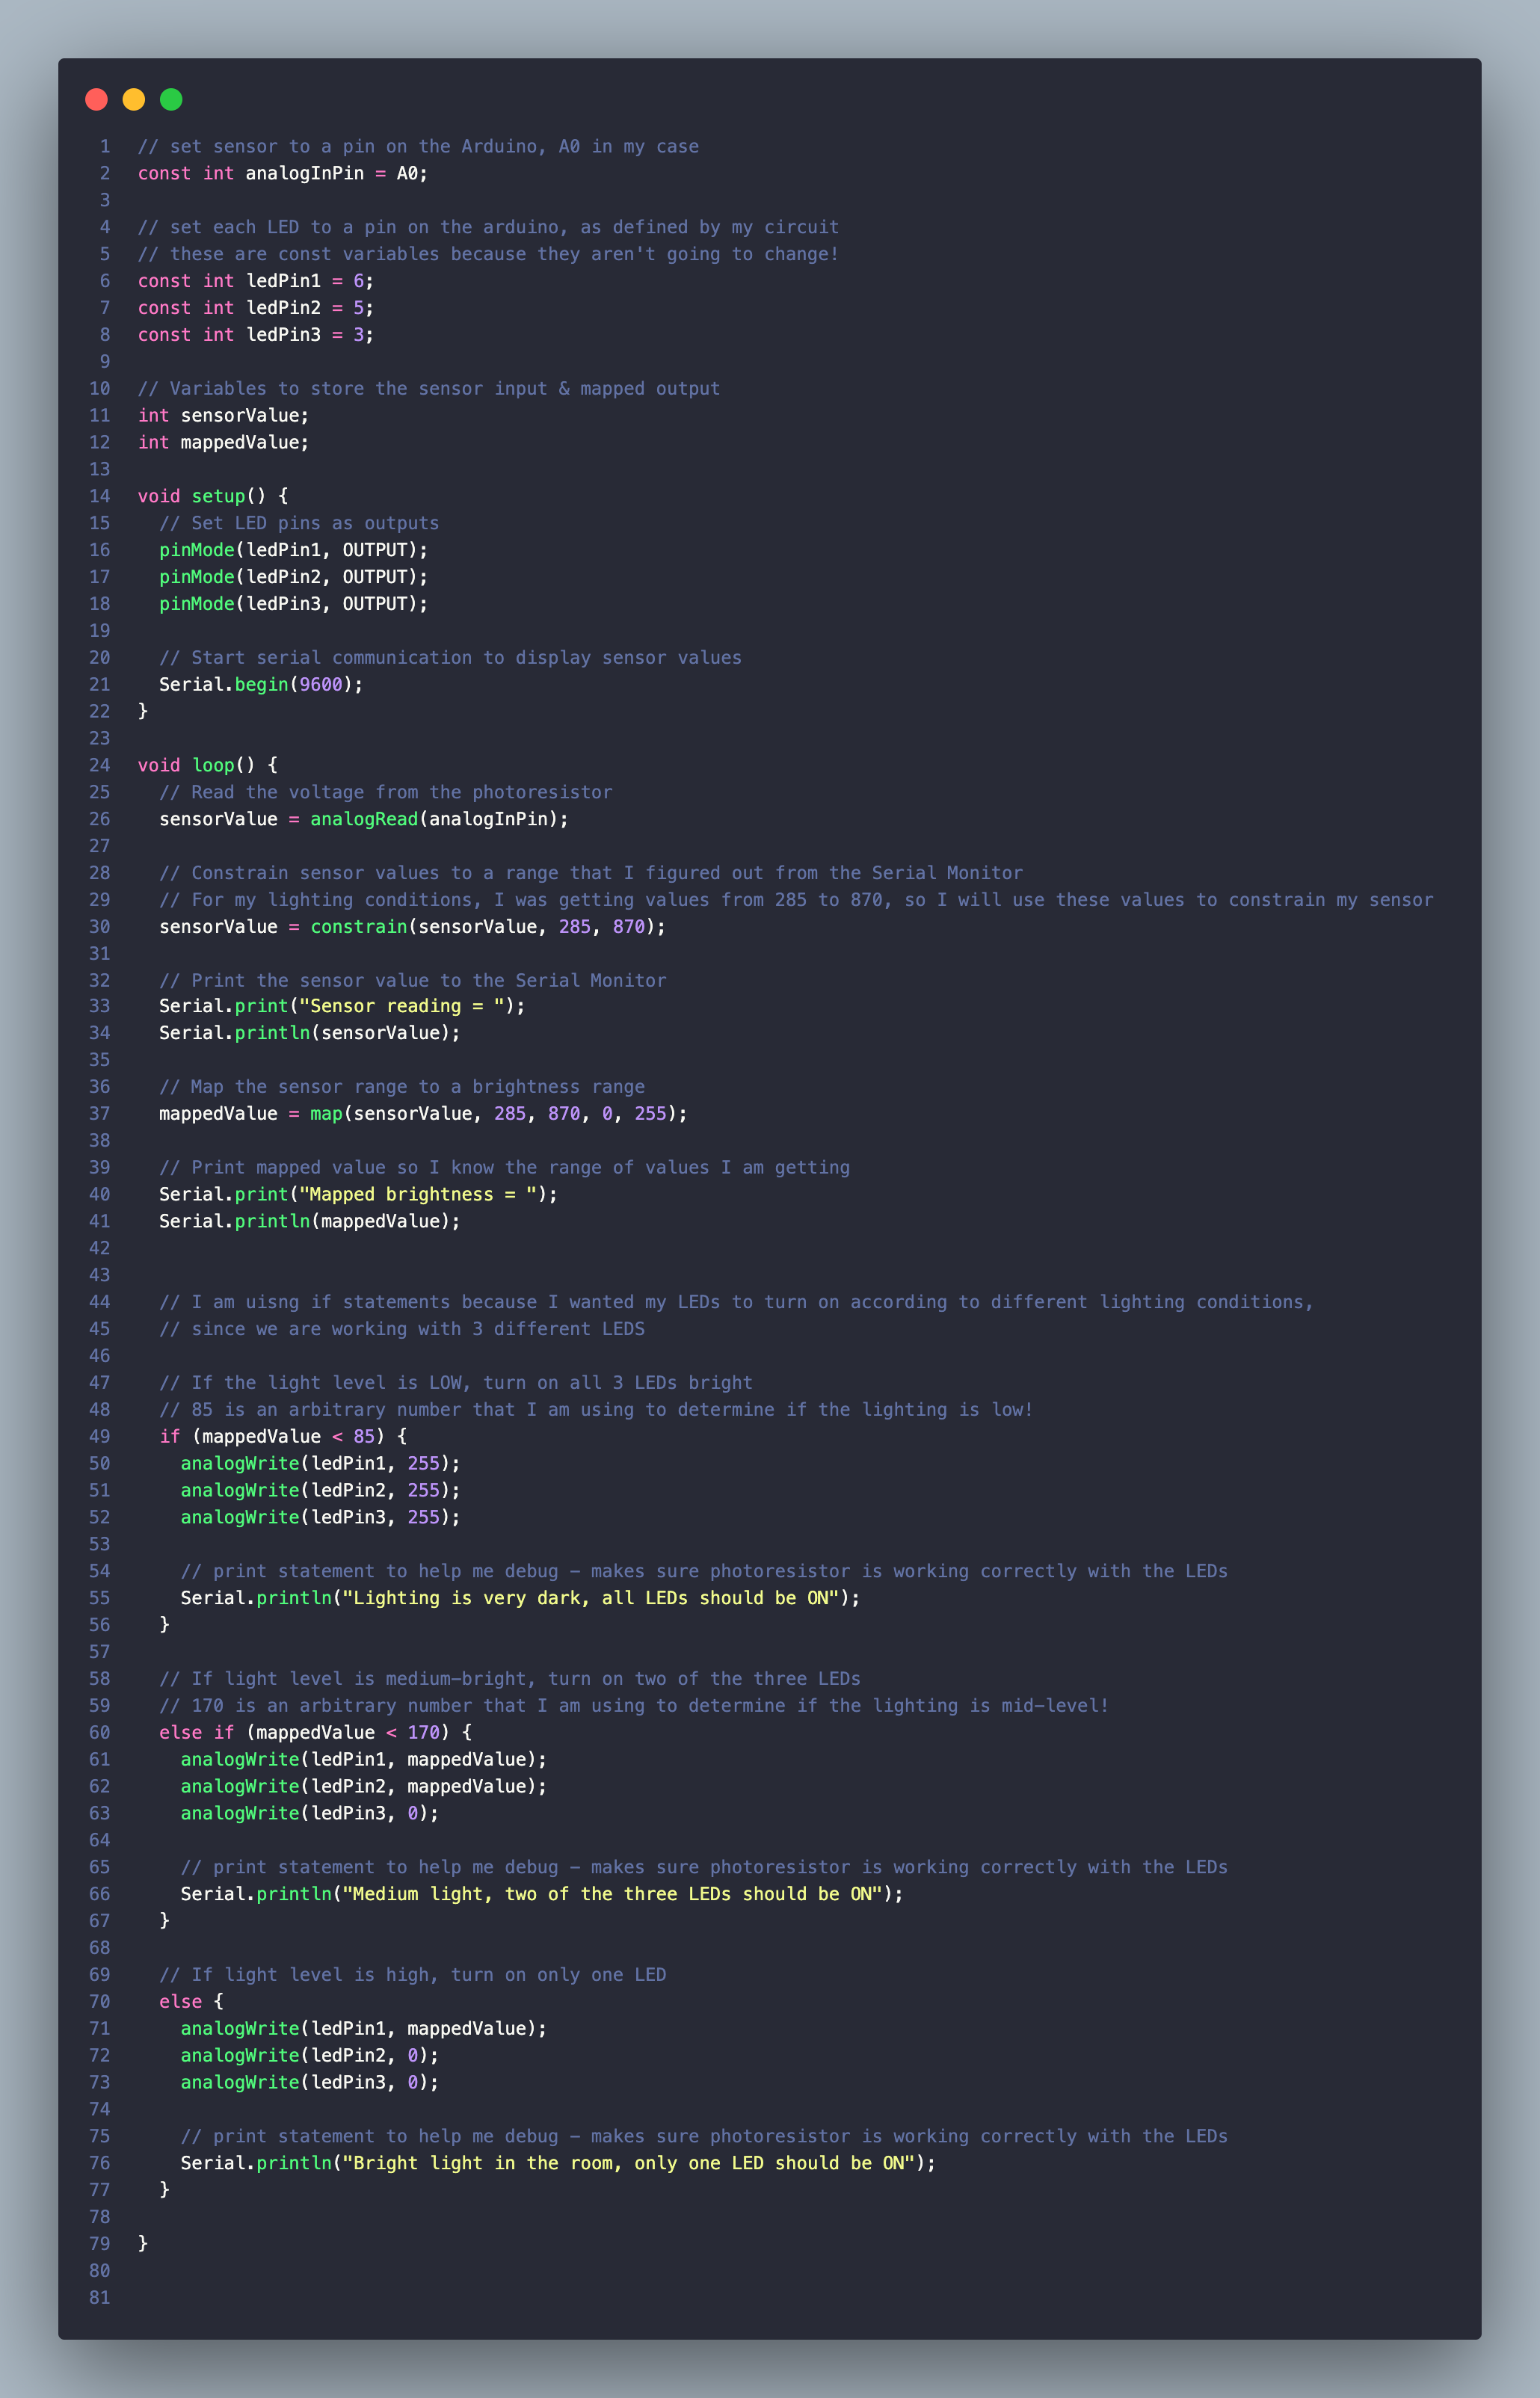
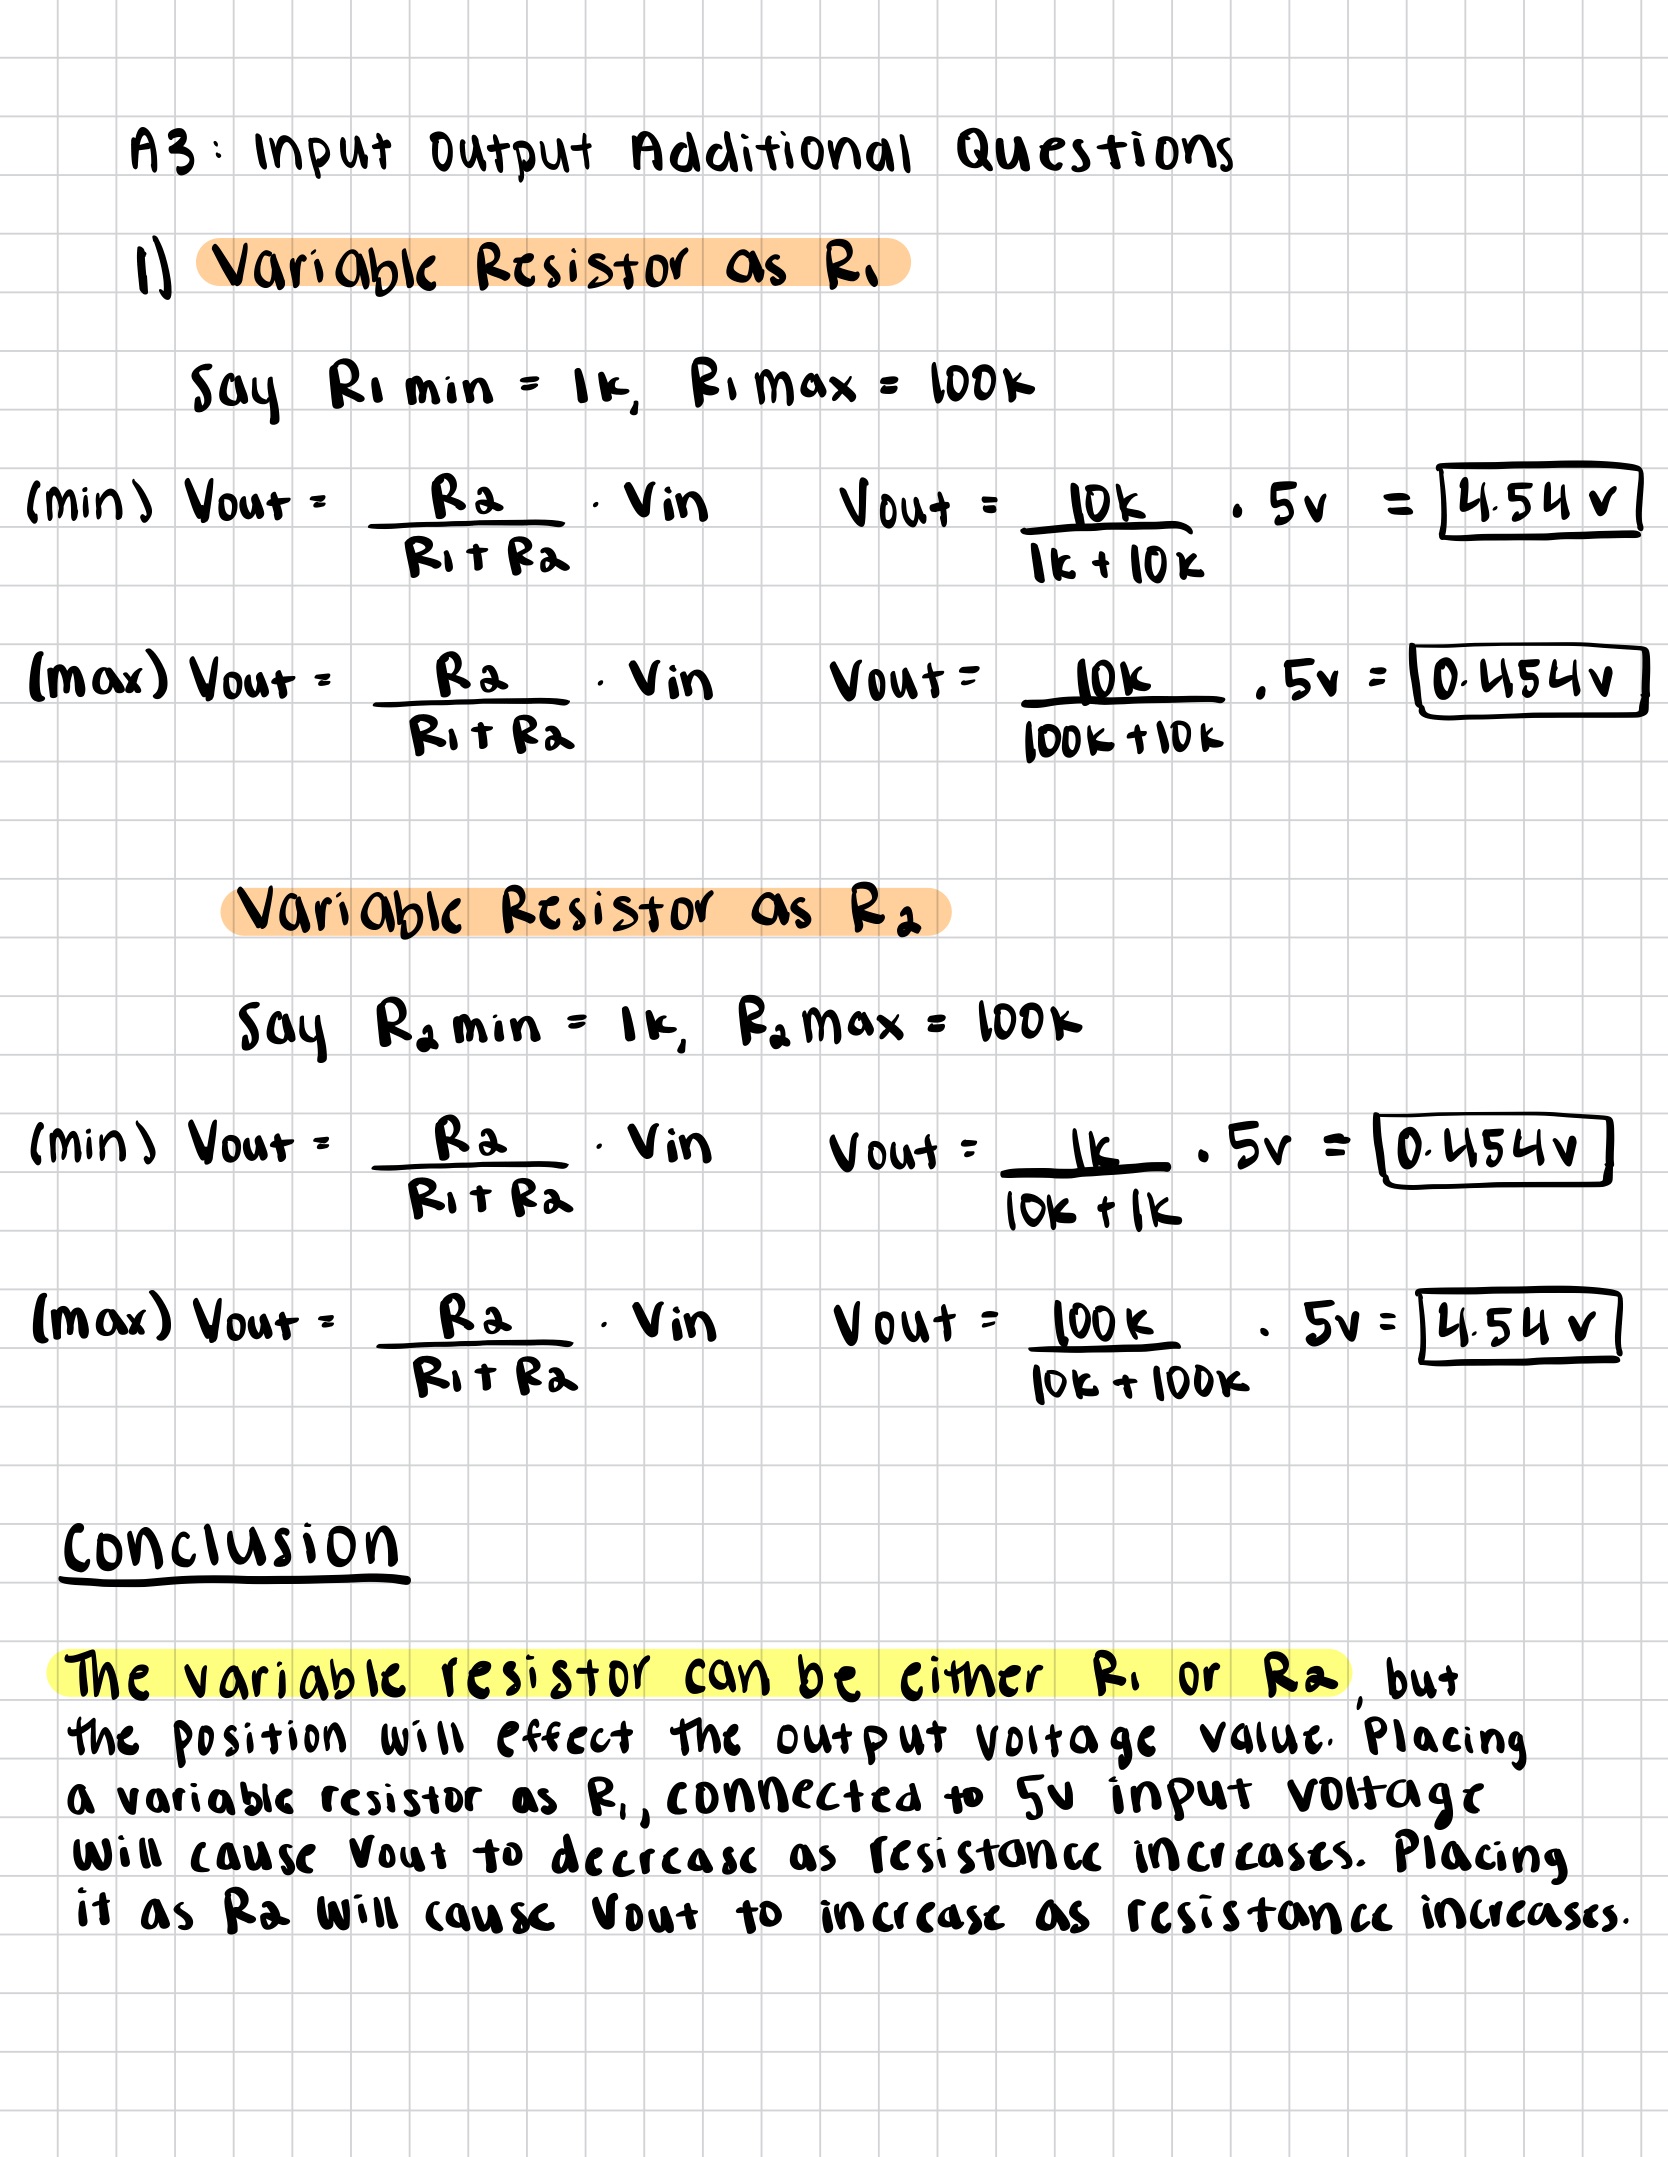
Assignment 3: Input/Output!

Here is all the documentation for assignment 3!

Schematic

Circuit Schematic Diagram Resistance Calculation

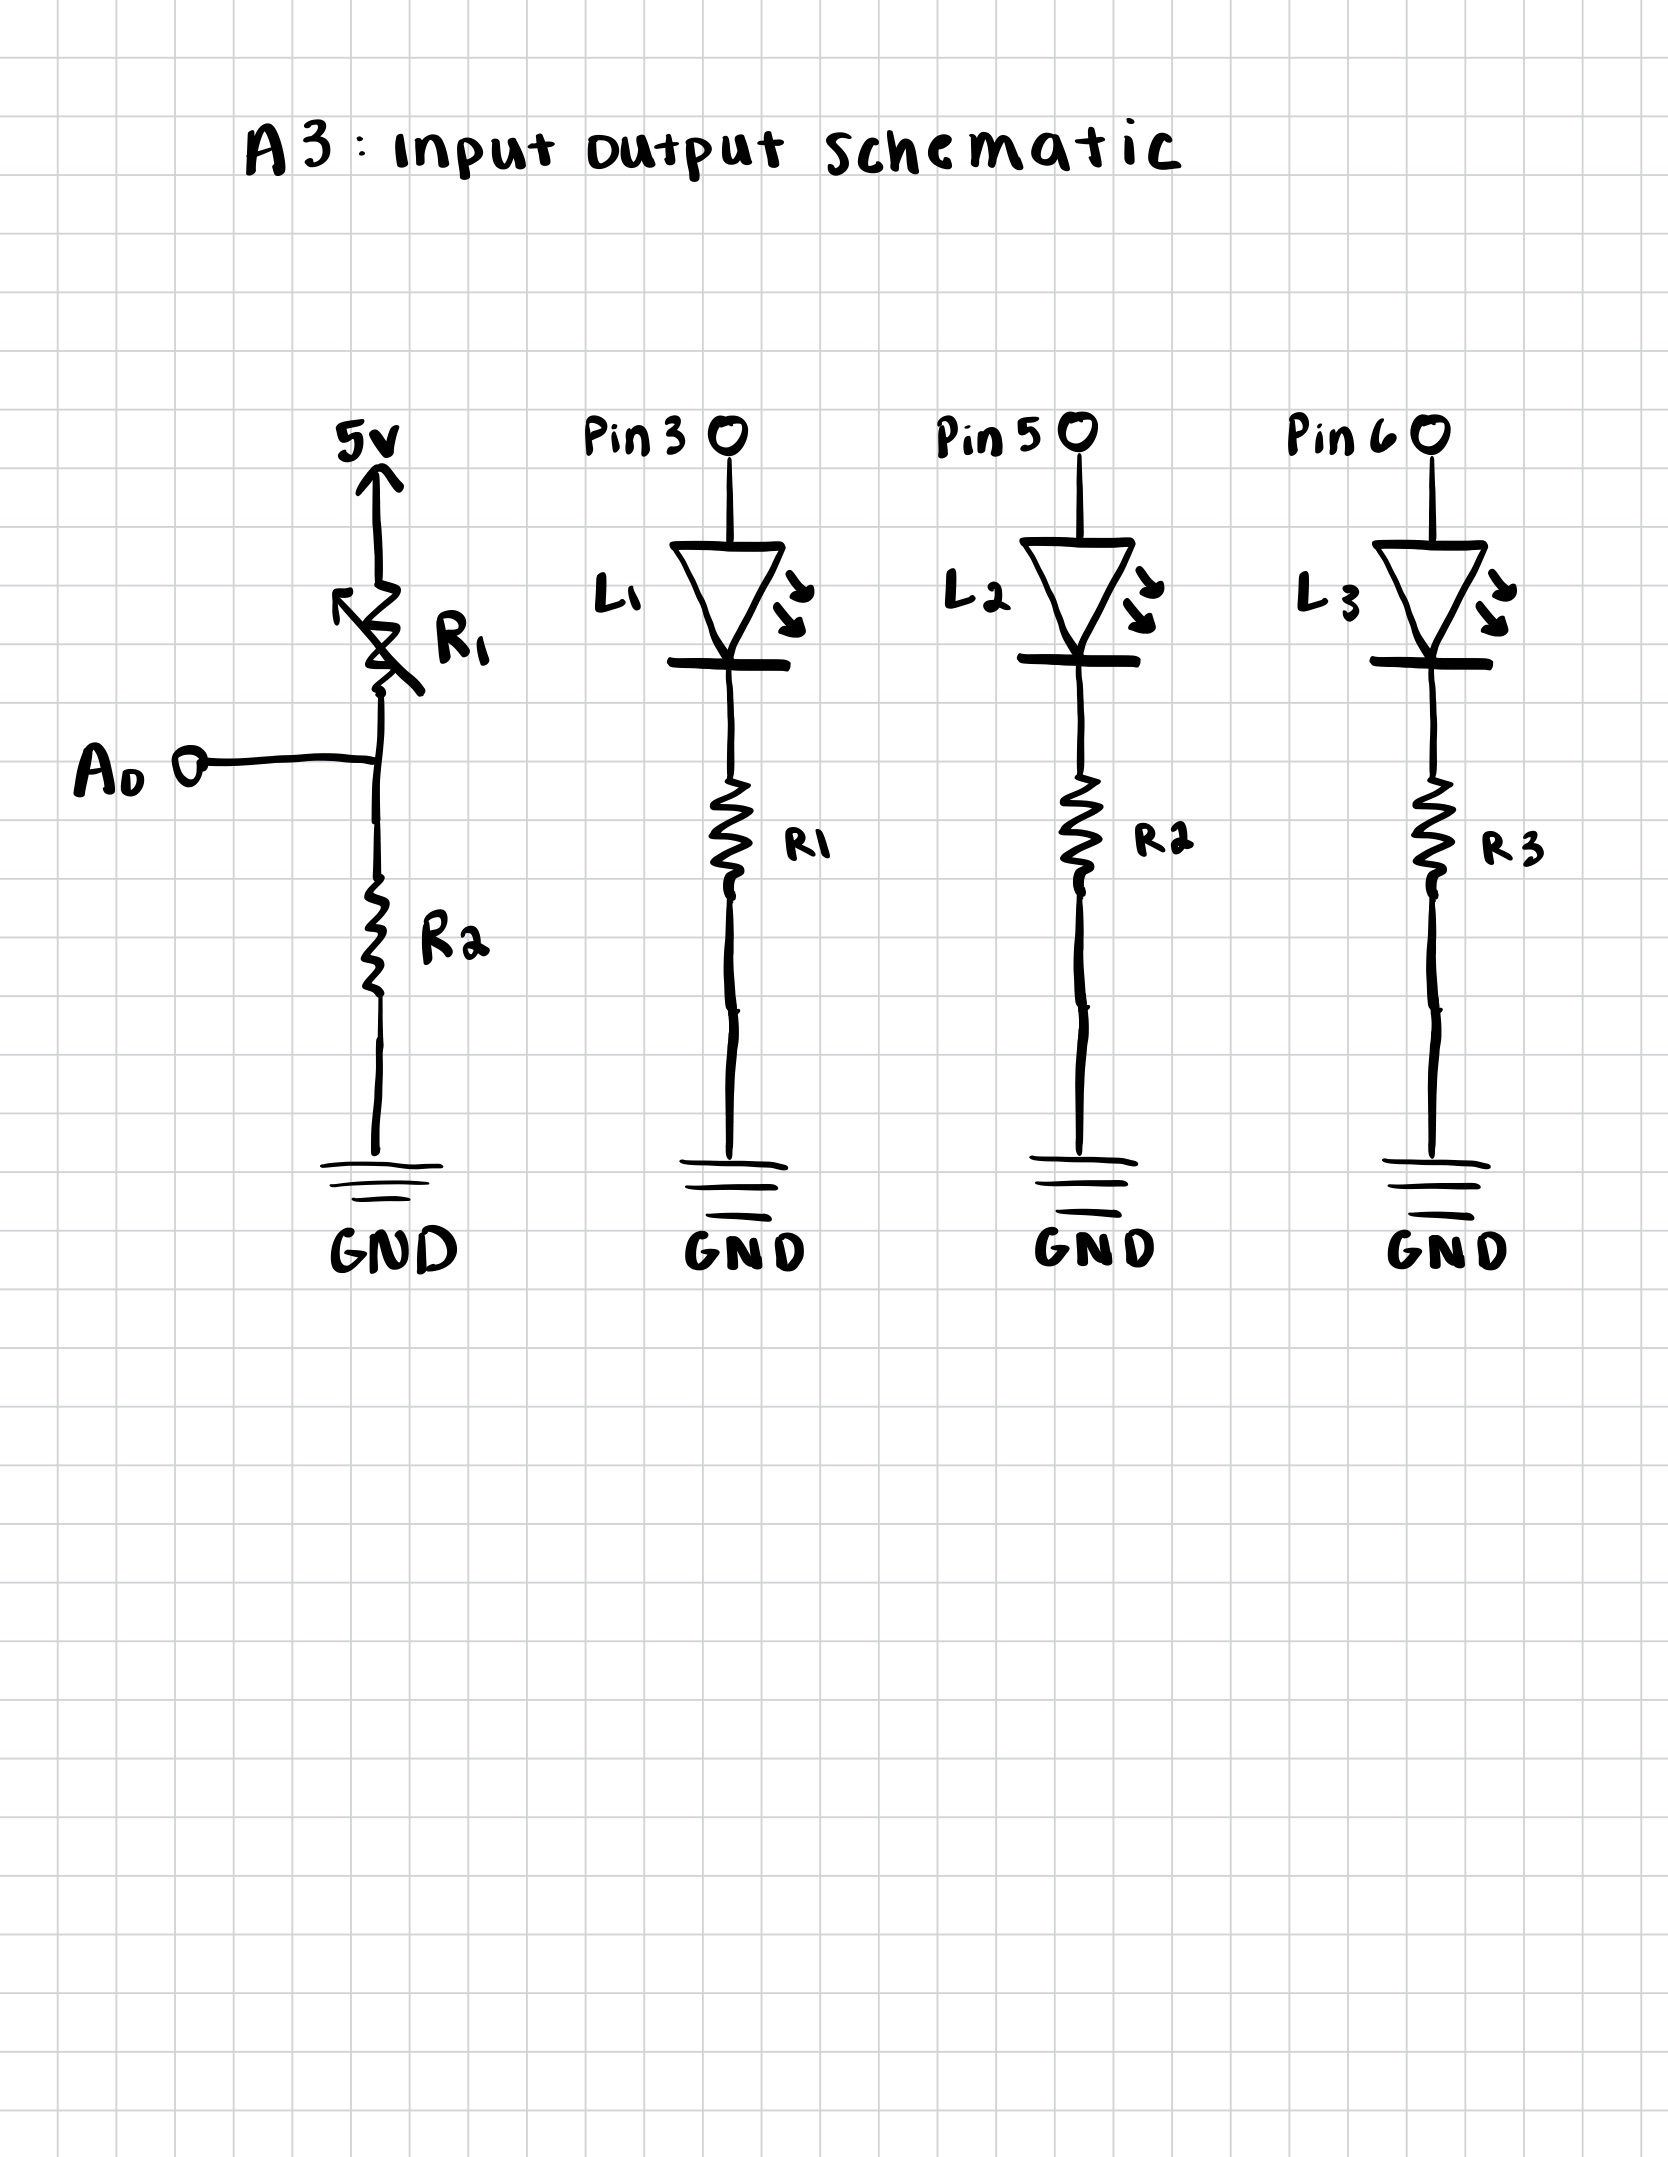
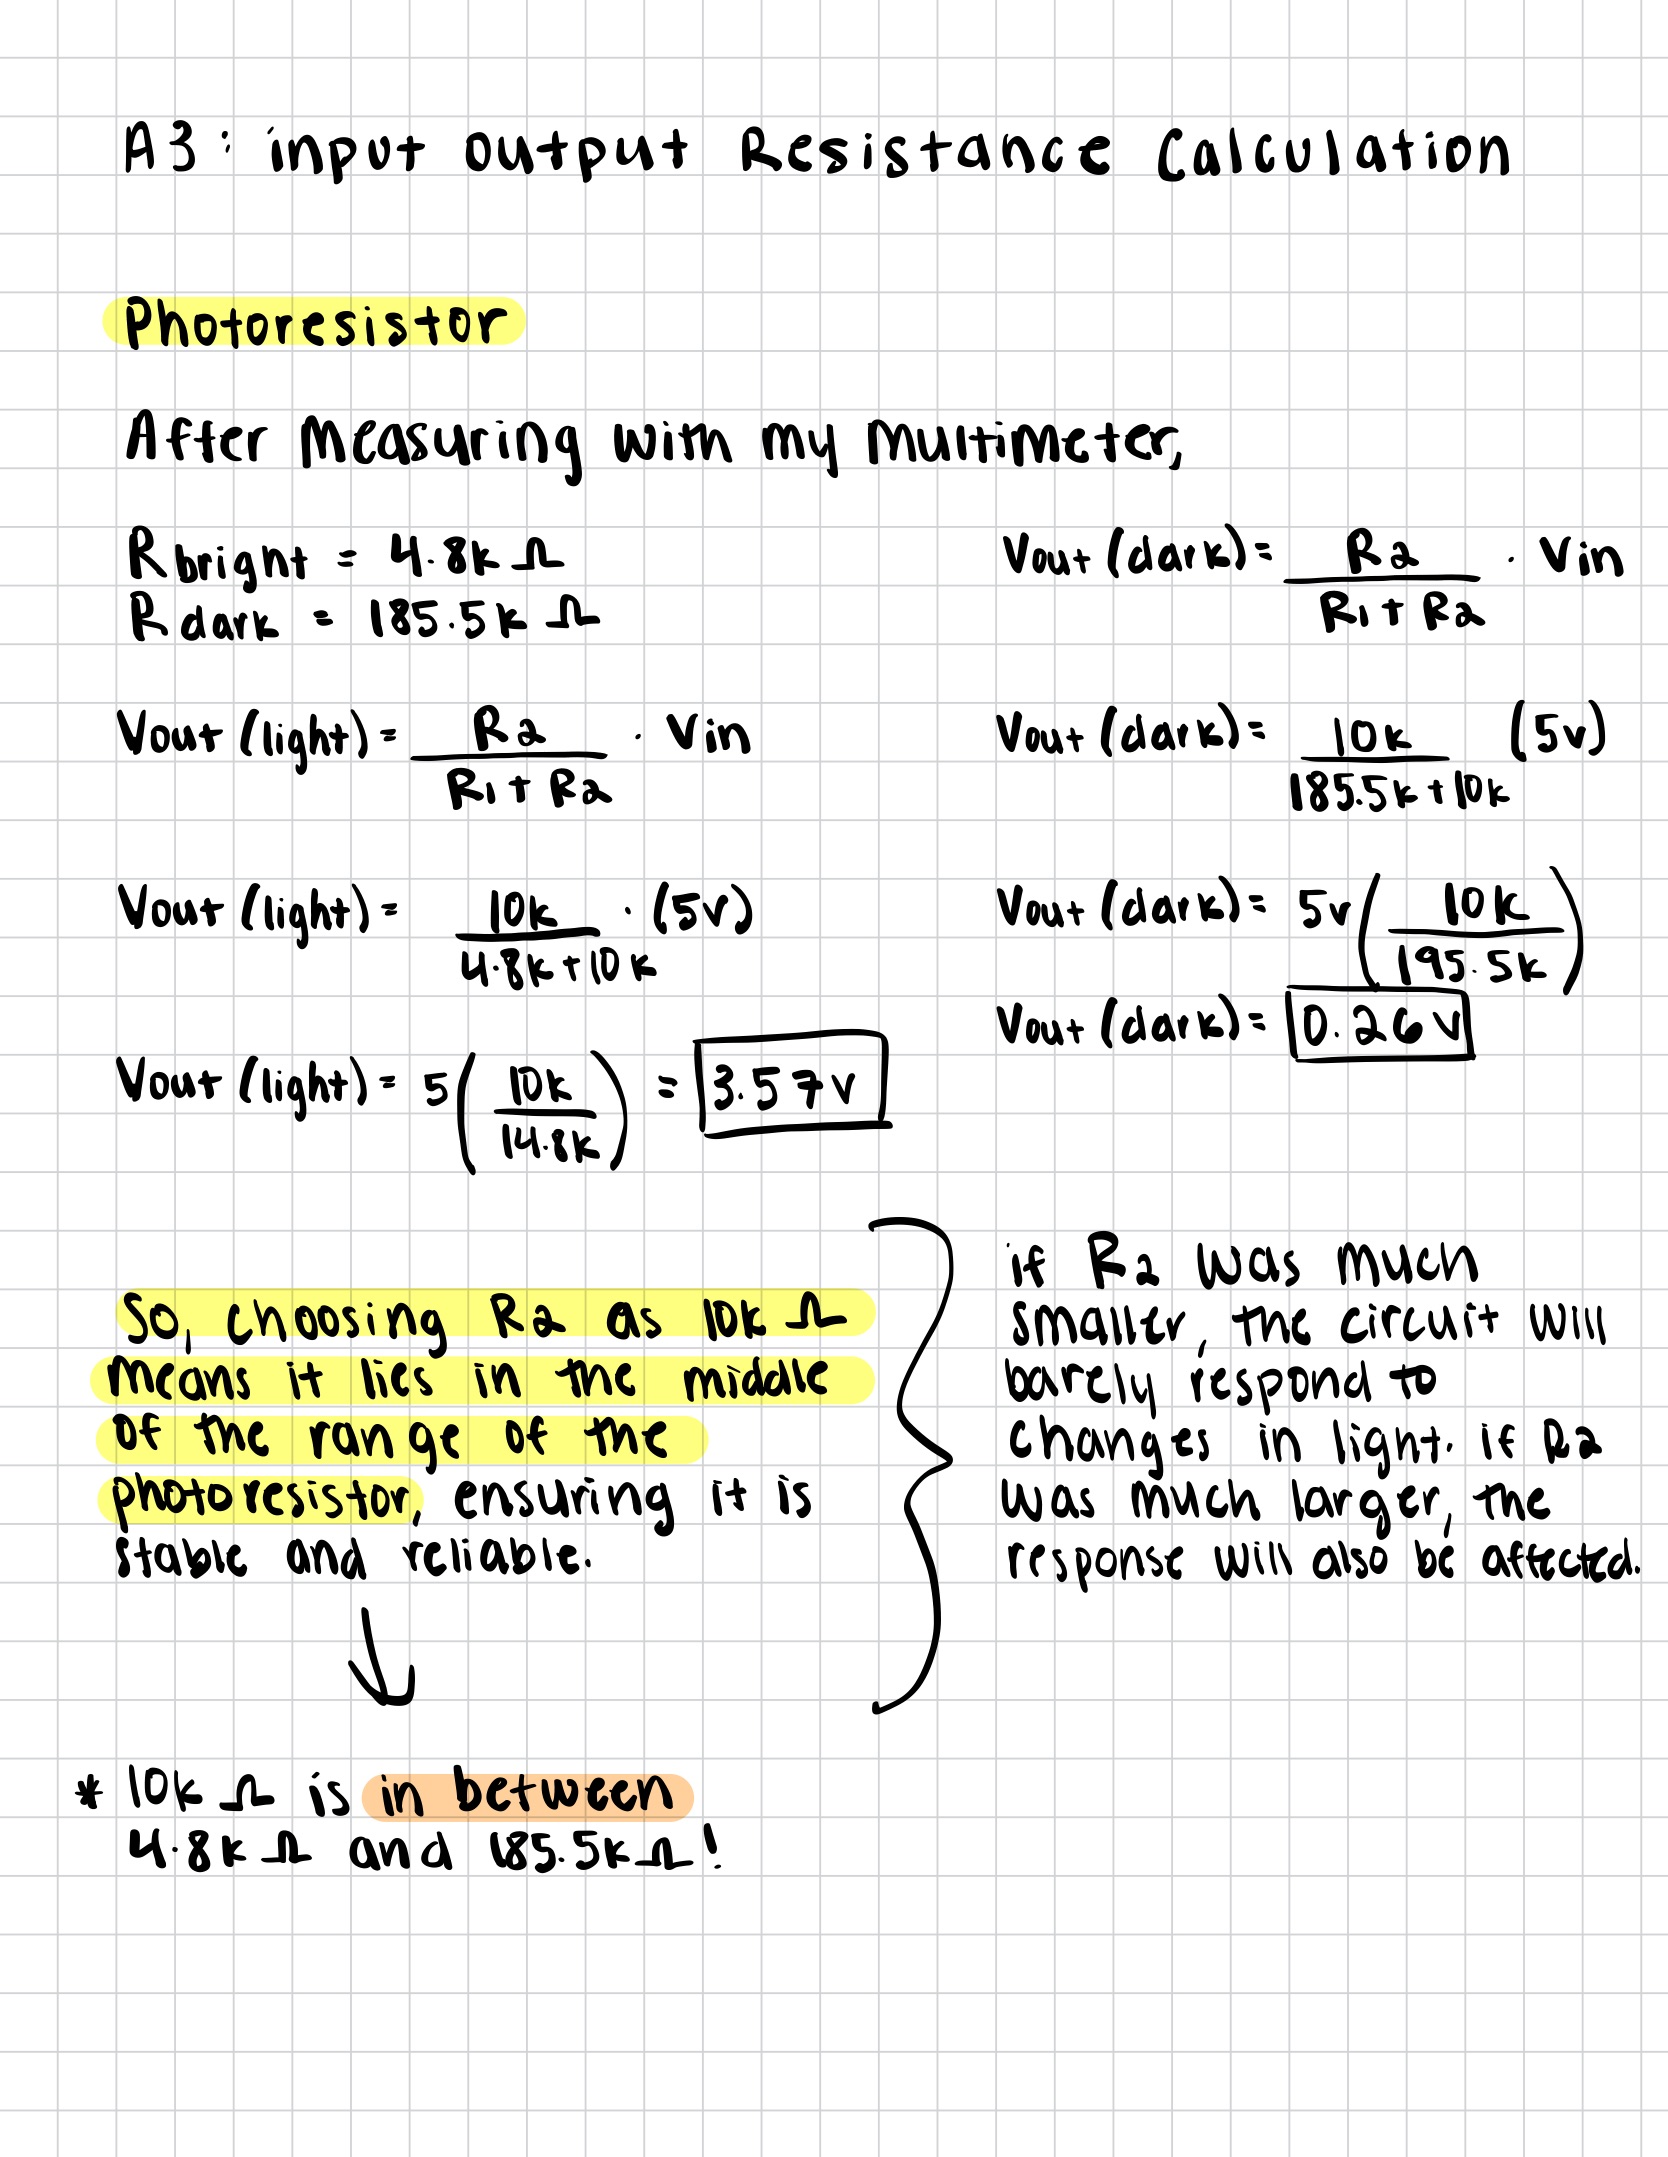
Schematic & Resistance Calculation Description: This schematic shows the circuit layout for assignment 3. The photoresistor and R2 form a voltage divider connected to the arduino's A0 pin. The three LEDs used in my circuit are connected to the arduino pins 3, 5, and 6 respectively. The second image shows my resistance calculation for R2!

Circuit

Physical Circuit Setup

Circuit Description: This photo shows the physical implementation of the circuit on a breadboard. I wired it this way so that as the light levels become darker, the sensor will tell all three of the LEDs to turn on. If the light levels are very bright, only the yellow will be on. With medium light levels, only the yellow and green LEDs will be on.

Firmware

Arduino Code Screenshot

Code Explanation: This Arduino code reads the voltage from a photoresistor using the analog pin A0 and maps it to a brightness range (0–255). Based on the mapped brightness, the code controls three LEDs according to different light levels: all LEDs turn on in dark lighting, two in medium light, and one in bright light. The program also prints the sensor readings to the Serial Monitor.

Circuit Operation

GIF Version: low quality :/

Animated GIF showing circuit operation

High Quality Video

Operation Description: The GIF and video above show how the circuit actually works according to different lighting levels.

Additional Questions

Questions 1, 2, and 3

Graph showing voltage across LEDs over time additional questions 2 and 3 Graph showing voltage across LEDs over time

Graph Explanation: This graph shows the voltage at the voltage divider over time according to different light levels. As expected, the voltage reading increases over time as the light levels increase, while the voltage reading is low in dark light. That matches what I see in my circuit operation video!

Question 5: AI Tools Usage

Answer: